

Abstract
Glandular trichomes are specialized anatomical structures that accumulate secretions with important biological roles in plant-environment interactions. These secretions also have commercial uses in the flavor, fragrance, and pharmaceutical industries. The capitate-stalked glandular trichomes of Cannabis sativa (cannabis), situated on the surfaces of the bracts of the female flowers, are the primary site for the biosynthesis and storage of resins rich in cannabinoids and terpenoids. In this study, we profiled nine commercial cannabis strains with purportedly different attributes, such as taste, color, smell, and genetic origin. Glandular trichomes were isolated from each of these strains, and cell type-specific transcriptome data sets were acquired. Cannabinoids and terpenoids were quantified in flower buds. Statistical analyses indicated that these data sets enable the high-resolution differentiation of strains by providing complementary information. Integrative analyses revealed a coexpression network of genes involved in the biosynthesis of both cannabinoids and terpenoids from imported precursors. Terpene synthase genes involved in the biosynthesis of the major monoterpenes and sesquiterpenes routinely assayed by cannabis testing laboratories were identified and functionally evaluated. In addition to cloning variants of previously characterized genes, specifically CsTPS14CT [(−)-limonene synthase] and CsTPS15CT (β-myrcene synthase), we functionally evaluated genes that encode enzymes with activities not previously described in cannabis, namely CsTPS18VF and CsTPS19BL (nerolidol/linalool synthases), CsTPS16CC (germacrene B synthase), and CsTPS20CT (hedycaryol synthase). This study lays the groundwork for developing a better understanding of the complex chemistry and biochemistry underlying resin accumulation across commercial cannabis strains.
Issue Section: BIOCHEMISTRY AND METABOLISM
Cannabis sativa (cannabis) was originally discovered in Central Asia and has likely been cultivated for tens of thousands of years by human civilizations, with the first mention about 5,000 years ago in Chinese texts (Unschuld, 1986). Whereas the initial utility was primarily as a source of grain and fiber, strains with medicinal properties were already in use in northwest China some 2,700 years ago, as evidenced by the detection of the psychoactive cannabinoid, (−)-trans-Ɗ9-tetrahydrocannabinol (THC), in plant residues recovered from an ancient grave (Russo et al., 2008). Cannabis strains containing less THC but more of the nonpsychoactive cannabidiol (CBD), commonly referred to as hemp, were grown in Roman Britain for grain and fiber but later found additional uses as a medicine during the Anglo-Saxon period (Grattan and Singer, 1952). The 1925 Geneva International Opium Convention required signatories to control the trade of certain drugs (including cannabis), which was followed by increasingly restrictive resolutions by the League of Nations and later the United Nations (United Nations, 1966). Until very recently, cannabis was considered an illicit substance of abuse by many governments and could only be researched by selected, authorized scientists in tightly supervised laboratories. Despite these restrictions, evidence for the medicinal potential was sufficiently convincing that, by the mid-1980s, the synthetic cannabinoids nabilone and dronabinol had been granted approval by the U.S. Food and Drug Administration to suppress nausea during chemotherapy (Abuhasira et al., 2018). The discovery of the existence of a high-affinity cannabinoid receptor in the rat brain during the late 1980s (Devane et al., 1988) prompted further research to identify the endogenous ligands. This resulted in the characterization, beginning in the early 1990s, of several lipid-based retrograde neurotransmitters (endocannabinoids) and multiple enzymes involved in their biosynthesis, trafficking, and perception (the endocannabinoid system), which were subsequently demonstrated to regulate a multitude of physiological and cognitive processes in humans and other animals (Devane et al., 1992). With receptor targets in hand, follow-up research and clinical trials brought several additional cannabis-related products to the pharmaceutical marketplace, including nabiximols (marketed as Sativex in Canada since 2005), a cannabis extract used to treat symptoms of multiple sclerosis, and a formulation of highly purified, plant-sourced CBD (marketed as Epidiolex in the United States since early 2018) to treat certain forms of epilepsy. In the meantime, several jurisdictions and even entire countries changed their policies on cannabis, endorsing laws that allow its therapeutic use and decriminalizing or even legalizing it for recreational purposes (Abuhasira et al., 2018). Legislation has not been able to keep up with these recent developments, and specific labeling regulations with regard to the composition of active ingredients, serving sizes, and recommended doses are woefully lacking (Subritzky et al., 2016). This situation is exacerbated by an inadequate understanding of how the chemistry (cannabinoids and other specialized metabolites) of cannabis extracts and formulations relates to their biological effects.
Since the original structural elucidation, during the early 1960s, of THC as a psychoactive principle in cannabis (Gaoni and Mechoulam, 1964), the structures of more than 90 biogenic cannabinoids have been reported to occur in members of the genus Cannabis (Andre et al., 2016), with a handful of constituents being the most prominent across strains (Fig. 1). These cannabinoids accumulate primarily in capitate-stalked glandular trichomes of female plants at the flowering stage. A second class of metabolites with high abundance and even greater chemical diversity in cannabis glandular trichomes are monoterpenes and sesquiterpenes (Fig. 1; Brenneisen, 2007). These volatile terpenoids are responsible for the distinctive aromas of different cannabis strains. The popular press and trade magazines liberally use the term “entourage effect” to suggest that synergism among cannabinoids or between cannabinoids and other constituents (in particular terpenoids) may contribute to different psychological perceptions of cannabis varieties by users. In support of this view, β-caryophyllene, a sesquiterpene with almost ubiquitous occurrence in plant oils and resins, was demonstrated to bind with high affinity to the CB2 cannabinoid receptor and has therefore been referred to as a dietary cannabinoid (Gertsch et al., 2008). However, there is only limited clinical evidence for entourage effects of terpenoids in cannabis formulations (Gertsch et al., 2010; Russo, 2011). Irrespective of these considerations, the chemical composition of each cannabis strain is unique, and acquiring a metabolic fingerprint is an excellent first step in building a more robust scientific foundation for assessing the correlation between the composition of plant material and the perception by users (Fischedick et al., 2010).
Figure 1.
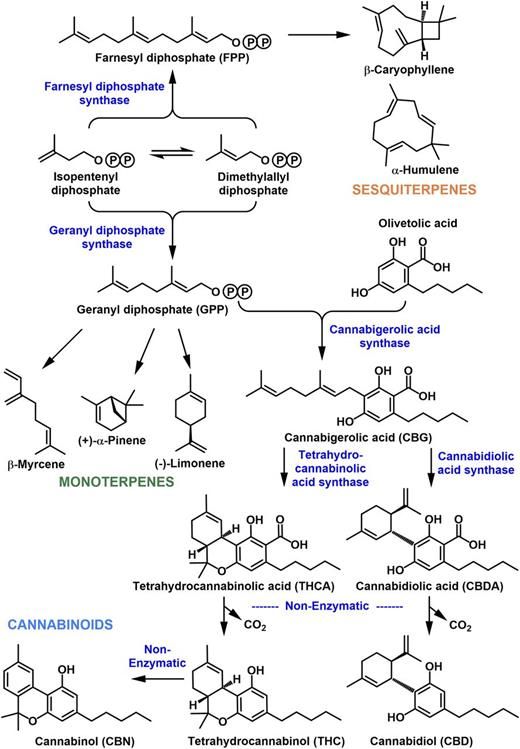
Shared origin of the cannabinoid and terpenoid biosynthetic pathways. A circled P denotes phosphate moieties.
Most of the cannabis products traded licitly or illicitly today are sourced from strains for which minimal documentation is available in the public domain and for which the primary goal was clearly to breed high-THC strains (Cascini et al., 2012). In other words, the genetics underlying chemical diversity in commercial cannabis strains is currently poorly understood (Welling et al., 2016). In this context, it is interesting that cannabinoids and terpenoids share a common biosynthetic origin. The biosynthesis of the prominent cannabinoids involves two direct precursor pathways. The polyketide pathway gives rise to olivetolic acid from a short-chain fatty acid intermediate (hexanoyl-CoA), whereas the methylerythritol 4-phosphate (MEP) pathway provides geranyl diphosphate (GPP; Fig. 1; Fellermeier et al., 2001; Taura et al., 2009; Gagne et al., 2012; Stout et al., 2012 ). An aromatic prenyltransferase catalyzes the formation of cannabigerolic acid from oilvetolic acid and GPP (Fellermeier and Zenk, 1998; Page and Boubakir, 2012). The pathway then branches again toward different cyclized products, such as tetrahydrocannabinolic acid (THCA), cannabidiolic acid (CBDA), and cannabichromanic acid (Fig. 1; Sirikantaramas et al., 2005; Taura et al., 2007). Reduced metabolic products of these acids are formed nonenzymatically by exposure to heat . Plant monoterpenes are mostly derived from the plastid-localized MEP pathway, whereas the cytosolic/peroxisomal mevalonate pathway is a common source of precursors for sesquiterpenes, although cross talk between both pathways has also been reported (Fig. 1; Hemmerlin et al., 2012). Terpene synthases catalyze the first committed step in the biosynthesis of a specific terpenoid from a prenyl diphosphate precursor of the appropriate chain length. To date, monoterpene synthases (accepting a C10 precursor) and sesquiterpene synthases (acting on a C15 precursor) that are responsible for the production of about half a dozen terpenoids in cannabis have been reported (Fig. 1; Günnewich et al., 2007; Booth et al., 2017), with many more awaiting functional characterization. In this article, we report the chemical profiles and corresponding gene networks across several cannabis strains, thereby building the foundation for a better understanding of their chemical and biochemical diversity.
RESULTS
Strategic Considerations for Logistics, Strain Selection, and Experimental Design
One of the goals of this pilot study was to test the utility of combining metabolic and transcriptomic data to differentiate cannabis strains with regard to the most relevant traits. To ensure the consistency of data sets, all plant materials were sourced from the same facility, where they had been maintained under comparable growth conditions (Shadowbox Farms in Williams, Oregon). Plant harvest was performed when the appearance of glandular trichome content had changed from a turbid white to clear and before another change to an amber-like color occurred. For most strains, the pistils had changed color from white to yellow or orange. These are the visual cues used by experienced growers to indicate optimal harvest time. All further processing was performed with fresh (uncured) material to avoid the previously reported loss of terpenoid volatiles during drying (Ross and ElSohly, 1996). Cannabinoids and terpenoids were extracted and quantified at a testing facility licensed according to the National Environmental Laboratory Accreditation Program’s TNI 2009 Standard (Evio Labs). At this facility, fractions highly enriched in glandular trichomes were obtained and RNA was isolated, with minor modifications, using previously established protocols (Lange et al., 2000). Glandular trichome-specific RNA sequencing (RNA-seq) data were then acquired by a commercial service provider (Quick Biology). Metabolite and transcriptome data were acquired for three biological replicates per strain.
This study involved a selection of strains with C. sativa ancestry, whereas Cannabis indica (formally classified as C. sativa forma indica) was dominant in others (Fig. 2). Strains of C. sativa provenance are generally characterized by fairly thin and narrow leaves, comparatively longer flowering cycles, and a relatively tall stature. A typical example in this study is Mama Thai, which is generally considered a landrace of C. sativa. In contrast, C. indica strains ordinarily have large and thick leaves, a rather short flowering cycle (6–8 weeks), and a proportionately short habitus (Fig. 2A). Our pilot study featured Blackberry Kush as a C. indica dominant strain. The remaining strains were hybrids of mixed C. sativa and C. indica lineage, plus one strain (Terple) with poorly documented origin (Fig. 2B).
Figure 2.
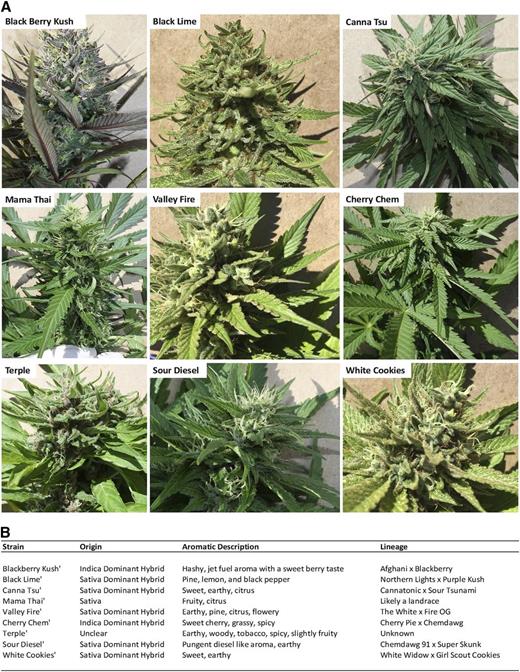
Characteristics of cannabis strains. A, Floral phenotypes. B, Origins and aroma descriptions (according to https://www.leafly.com).
To address our goal of assessing the utility of our data for classifying strains, RNA-seq and chemical data (cannabinoid and terpenoid profiles) were subjected to multivariate statistical analyses. We then tested the hypothesis that cannabinoid and terpenoid pathways are coregulated by performing gene coexpression network analyses. A combination of gene network and phylogenetic analyses was subsequently used to identify candidate genes for hitherto uncharacterized terpene synthases that contribute significantly to the cannabis volatile bouquet.
Strain Differentiation Based on RNA-Seq Data
High-quality libraries reflecting transcripts expressed in isolated glandular trichomes were subjected to RNA-seq analysis (nine strains, three biological replicates each, 27 samples total) on the Illumina HiSeq 4000 platform. A de novo consensus transcriptome assembly was generated using the Trinity suite (Haas et al., 2013; assembly statistics are given in Supplemental Table S1). The reads were assembled into contigs covering a total of 305 Mb of sequence with a GC content of 40.4%. The resulting assembly produced an N50 (sum of the lengths of all contigs of N50 value or longer contain at least 50 % of the total transcriptome sequence) value of 833 bp, containing 514,208 contigs of at least 201 bp in length. The assembled transcriptome data set was searched against the National Center for Biotechnology Information nonredundant protein database, which resulted in the annotation of 82,523 sequences at e-values < 1e-5. Read counts for each transcript in each sample were then processed with the RSEM software package (Li and Dewey, 2011) to calculate normalized expression levels as transcripts per kilobase million (TPM). Transcripts with TPM values lower than 5 across all varieties were removed from subsequent analysis, resulting in 46,559 predicted genes with significant expression (Supplemental Table S2).
As a first step to investigate the utility of RNA-seq for strain categorization, transcriptome data sets were subjected to principal component analysis (PCA), a statistical procedure that reduces attribute space from a larger number of variables to a smaller number of so-called principal components, thereby decreasing the dimensionality of the original data. The first three principal components accounted for 83% of the variability in the data set (Fig. 3A). The replicates for each strain clustered together in a three-dimensional PCA plot, whereas the component scores for each strain were separated from those of all other strains, indicating that the overall transcriptome of each strain is unique (Fig. 3A). Processing of RNA-seq data by hierarchical clustering analysis (HCA), which builds a cluster hierarchy that is commonly displayed as a dendrogram, grouped strains into two major clades (Fig. 3B). The first clade contained Blackberry Kush, Cherry Chem, and Terple, whereas the second consisted of Mama Thai, White Cookies, Valley Fire, Black Lime, Canna Tsu, and Sour Diesel, indicating a clear separation of strains by heritage (C. indica for clade 1 and C. sativa for clade 2).
Figure 3.
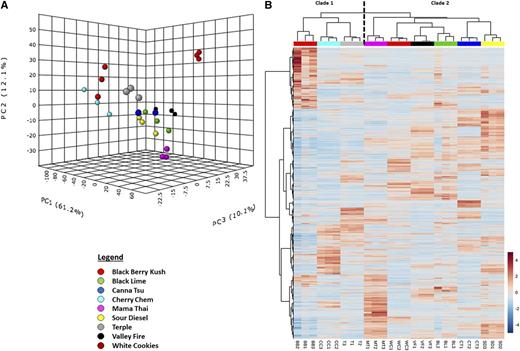
Cannabis strain differentiation based on glandular trichome-specific RNA-seq data. A, Three-dimensional plot representing outcomes of a PCA. B, Heat map of a two-way HCA. The numerical values and red-white-blue color code indicate the log2 fold change compared with the average gene expression value across all strains. Strain abbreviations at the bottom of B are as follows: BB, Blackberry Kush; BL, Black Lime; CC, Cherry Chem; CT, Canna Tsu; MT, Mama Thai; SD, Sour Diesel; T, Terple; VF, Valley Fire; WC, White Cookies.
Strain Differentiation Based on Metabolite Profiling Data
The highly robust analytical platforms that served as the basis for the analysis of six cannabinoids and 24 terpenoids were described in a previous report (Fischedick et al., 2010) and used here with minor modifications. Cannabinoid concentration was highest in White Cookies (28.4% of flower bud dry weight), with relatively high contents also occurring in Cherry Chem (17.7%), Black Lime (17.5%), Backberry Kush (15.8%), Valley Fire (15.7%), Terple (15.6%), Sour Diesel (12.4%), and Canna Tsu (12.2%; Table 1). Significantly lower concentrations were detected in Mama Thai (6.4%). In eight of the nine strains investigated, THCA was the major cannabinoid, ranging from 26.3% of the flower bud dry weight in White Cookies to 5.9% in Mama Thai (Table 1). The only exception was the Canna Tsu strain, in which CBDA (7.8% of flower bud dry weight) dominated over THCA (3.2%), whereas CBDA in all other strains remained at 1% or less. Two additional cannabinoids of fairly high abundance were cannabinol, which accumulated to 0.2% to 1.7% of flower bud dry weight, and tetrahydrocannabinol, which amounted to 0.2% to 1.6% (Table 1; for structures, see Fig. 1). Cannabichromene was not detected in any of the sampled varieties.
Constituents of cannabis female flower buds (metabolite content in nine strains expressed as percentage of dry weight)
Table 1. Constituents of cannabis female flower buds (metabolite content in nine strains expressed as percentage of dry weight).
Terpenoid content was highest in Black Lime (8.8% of flower bud dry weight), with fairly high contents also occurring in White Cookies (4.8%), Terple (4.8%), Valley Fire (3.8%), Cherry Chem (3.5%), Blackberry Kush (3.4%), and Canna Tsu (3.3%; Table 1). Significantly lower concentrations were detected in Sour Diesel (1.8%) and Mama Thai (0.7%). The monoterpene (C10)-to-sesquiterpene (C15) ratio was generally very high (greater than 10), with only three strains in which the ratio was below 3 (Cherry Chem, Mama Thai, and Sour Diesel; Table 1). It should be noted that this ratio only applies to the terpenoids we were able to quantify based on the availability of authentic standards. β-Myrcene was the most abundant monoterpene in most strains (up to 4.3% of flower bud dry weight in Black Lime). The only exceptions were Mama Thai (generally low terpenoid contents, with terpinolene as the most abundant monoterpene at 0.1%) and White Cookies (with limonene at 1.5%; Table 1). Limonene content was also high in Black Lime (0.9%) and Valley Fire (0.7%). α-Pinene and β-pinene amounts were quite high in Black Lime (2% and 0.5%, respectively). 1,8-Cineole was particularly abundant in Canna Tsu and Cherry Chem (0.5% in both; Table 1). All other monoterpenes had concentrations below 0.2%. All strains contained sesquiterpenes, of which β-caryophyllene was consistently the most abundant (0.1%–0.7% of flower bud dry weight). α-Humulene was also detectable in all strains (less than 0.2%), whereas Black Lime was the only strain in which the nerolidol concentration rose above the limit of quantitation (less than 0.1%; Table 1).
Processing of the metabolite data (cannabinoid and terpenoid profiles) by PCA resulted in a clear separation of the strains, with individual biological replicates clustering closely together (Fig. 4A). Remarkably, 99% of the data variation across genotypes was captured by the first three principal components. Application of orthogonal projections to latent structures discriminant analysis (OPLS-DA), a statistical modeling tool used commonly in metabolomics research (Worley and Powers, 2013), indicated a separation of strains into two groups based on our metabolite profiling data, one representing the C. indica-dominant strains, whereas the other constituted the C. sativa-dominant strains (Fig. 4B). Biological replicates for each strain once again clustered together, whereas significant separation was observed across strains. In summary, glandular trichome-specific gene expression and metabolite data were consistent in differentiating cannabis strains.
Figure 4.

Cannabis strain differentiation based on cannabinoid and terpenoid profiles. A, Three-dimensional plot representing outcomes of a PCA. B, Two-dimensional plot of the outcomes of OPLS-DA.
Evidence for Coexpression of Cannabinoid and Terpenoid Pathways
Our glandular trichome RNA-seq data sets were filtered to eliminate genes with consistently low expression levels (below 50 TPM), thereby retaining roughly 16,000 expressed genes with significant expression levels in at least one strain. Gene abundance across strains was then evaluated using the weighted gene correlation network analysis (WGCNA) package in R (Langfelder and Horvath, 2008), which resulted in the binning of genes (only those with Spearman correlation coefficients [SCCs] ≥ 0.8 were considered) into seven coexpression modules (Supplemental Table S3). Further analysis using the moduleEigengenes function indicated that the accumulation of CBDA, the signature cannabinoid of the Canna Tsu strain, was highly correlated (SCC of 0.97, P value of 2e-17) with one of the coexpression modules (indicated by brown color in Fig. 5A). Interestingly, this module contained the gene coding for CBDA synthase, the enzyme responsible for the conversion of cannabigerolic acid to CBDA (Table 2). An analogous analysis for THCA or THC (which correlated with a module indicated by yellow color in Fig. 5A) and THCA synthase was not possible, because single-nucleotide polymorphisms in this gene (and not lack of expression) result in an inactive enzyme in strains that accumulate primarily CBDA (Kojoma et al., 2006; Laverty et al., 2019; Table 2). Interestingly, the THCA synthase sequences were essentially identical, with the exception of that of the Canna Tsu strain, the only CBDA accumulator in our pilot study (Supplemental Fig. S1). Consequently, a full-length CBDA synthase gene was expressed only in the Canna Tsu strain (Supplemental Fig. S2), which is novel information that furthers our understanding of the mechanisms underlying CBDA accumulation. Finally, the yellow-colored module (which as mentioned above contained THCA synthase) also comprised cannabigerolic acid synthase (Table 2), the gene preceding THCA synthase in the cannabinoid pathway (Fig. 1), thereby providing additional evidence for gene-to-metabolite correlation in the cannabinoid pathway.
Figure 5.
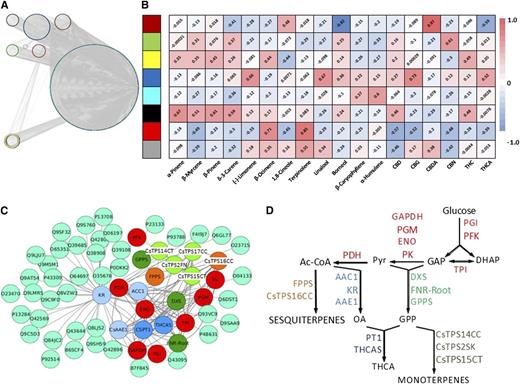
Coexpression of genes involved in cannabinoid and terpenoid biosynthesis. A, WGCNA of glandular trichome-specific RNA-seq data categorizes transcripts into eight color-coded modules (for gene lists, see Supplemental Table S3). B, Correlation of WGCNA modules with metabolites. A color code is used to visualize the SCCs for each module-metabolite pair, with red color representing positive and blue color indicating negative SCCs. C, Genes involved in cannabinoid and terpenoid biosynthesis are enriched in the yellow coexpression module obtained by WGCNA. Color code for pathways: light blue, hexanoate formation; dark green, precursors for monoterpenes; light green, monoterpene synthases; orange, sesquiterpenes; dark blue, cannabinoids; cyan, remaining genes. D, Functional context of genes highlighted in C in a simplified metabolic pathway scheme. AAE1, Acyl-activating enzyme for short-chain fatty acids; Ac-CoA, acetyl-CoA; ACC1, acetyl-CoA carboxylase; CsTPS1FN/CsTPS14CT, (−)-limonene synthase; CsTPS2SK, (+)-α-pinene synthase; CsTPS3FN/CsTPS15CT, β-myrcene synthase; CsTPS16CC, germacrene B synthase; DHAP, dihydroxyacetone phosphate; DXS, 1-deoxy-D-xylulose-5-phosphate synthase; ENO, enolase; FNR-Root, ferredoxin-NADP+ reductase (isoform of roots and glandular trichomes); FPPS, farnesyl diphosphate synthase; GAP, glyceraldehyde-3-phosphate; GAPDH, glyceraldehyde-3-phosphate dehydrogenase; GPP, geranyl diphosphate; GPPS, geranyl diphosphate synthase; KR, β-ketoacyl reductase (fatty acid synthase complex); OA, olivetolic acid; PDH, pyruvate dehydrogenase; PFK, phosphofructokinase; PGI, phosphoglucoisomerase; PGM, phosphoglucomutase; PK, pyruvate kinase; PT1, cannabigerolic acid synthase; Pyr, pyruvate; THCAS, tetrahydrocannabinolic acid synthase; TPI, triose phosphate isomerase.
Transcript abundance (in TPM) for genes involved in the biosynthesis of cannabinoids and terpenoids in cannabis strains
Table 2. Transcript abundance (in TPM) for genes involved in the biosynthesis of cannabinoids and terpenoids in cannabis strains.
We then asked if similar gene-to-metabolite correlations occurred in the terpenoid pathway. Interestingly, two coexpression modules (indicated by black and yellow color in Fig. 5A) correlated with β-myrcene accumulation (Fig. 5B). This metabolite is formed by a monoterpene synthase encoded by the CsTPS3FN gene (Booth et al., 2017), which was contained in one of these modules (yellow color in Fig. 5A; Table 3). Analogous gene-to-metabolite correlations were observed for limonene and CsTPS1FN, α-pinene and CsTPS2FN, β-ocimene and CsTPS6FN, and β-caryophyllene/α-humulene and CsTPS9FN (color of modules in Fig. 5A: black, yellow, and yellow, turquoise, respectively; terpene synthase annotation based on Günnewich et al. [2007] and Booth et al. [2017]; Fig. 5B). Transcripts corresponding to CsTPS5FN (β-myrcene/α-pinene synthase), CsTPS4FN (alloaromadendrene synthase), CsTPS8FN (γ-eudesmol/valencene synthase), and CsTPS13PK (a second β-ocimene synthase; Booth et al., 2017) remained below the threshold expression level in our data sets. The corresponding terpenoids were not detected in the strains investigated, indicating that the expressed gene complement was generally sufficient to account for the presence of the major terpenoids (Table 3). Linalool and nerolidol were exceptions for which the corresponding terpene synthases had hitherto not been identified from cannabis. Notably, genes involved in the formation of these terpenoids (and others) were cloned and functionally characterized as part of this study, which contributes significantly to a better understanding of the genetic underpinnings of terpenoid diversity.
Transcript abundance (in TPM) for terpene synthases across cannabis strains
Table 3. Transcript abundance (in TPM) for terpene synthases across cannabis strains.
The yellow module featured prominently in our gene-to-metabolite correlation analysis for the cannabinoid and terpenoid pathways. Interestingly, a Gene Ontology (GO) analysis implied a substantial enrichment of genes involved in terpenoid biosynthesis in the yellow module (P value of 1.4e-05; Supplemental Table S3; note that GO terms for cannabinoid biosynthesis as a biological process have not yet been released). Interestingly, a total of 22 genes involved in the conversion of precursor metabolites into cannabinoid and terpenoid end products were coexpressed with THCA synthase (Fig. 5C). Specifically, these genes code for enzymes involved in glycolysis (conversion of an imported carbon source into triose phosphates and pyruvic acid), the MEP pathway toward GPP and ultimately monoterpenes, the production of sesquiterpenes, the formation of olivetolic acid from fatty acid precursors, and the incorporation of olivetolic acid and GPP into cannabinoids (Fig. 5D).
Target Gene Identification and Characterization
Building on our terpenoid profiling and glandular trichome-specific transcriptome data sets, we embarked on gene discovery efforts aimed at characterizing terpene synthases associated with the biosynthesis of major monoterpenes and sesquiterpenes routinely quantified in commercial cannabis testing as well as other terpenoids that are not assayed routinely. The analytical chemistry data were employed to assess which genes would be expected to be expressed to support the observed terpenoid profiles. We then performed BLASTX searches with previously characterized terpene synthases to identify contigs with high sequence identity in our transcriptome data sets. We then asked which of the putative cannabis terpene synthases were expressed at appreciable levels in particular cannabis strains. Sequences of selected contigs were then chosen to perform a sequence relatedness analysis with previously characterized terpene synthases, thereby enabling their categorization by class. cDNAs of putative terpene synthases were cloned into appropriate vectors and expressed heterologously in Escherichia coli, the corresponding recombinant proteins were purified, and assays were performed with appropriate prenyl diphosphate substrates. Expression for genes putatively encoding geranyl diphosphate synthase and trans,trans-farnesyl diphosphate synthase was readily detectable in transcriptome data sets of all strains; in contrast, no putative orthologs of neryl diphosphate (NPP) synthase and cis,cis-farnesyl diphosphate synthase were recognizable based on sequence identity (Supplemental Tables S1 and S2). Nevertheless, terpene synthase assays were performed with GPP, NPP, 2-trans,6-trans-farnesyl diphosphate (tFPP), and 2-cis,6-cis-farnesyl diphosphate (cFPP).
β-Myrcene and (−)-limonene were principal monoterpenes in all strains (Table 1), and expectedly, contigs with high sequence identity to the previously characterized β-myrcene and (−)-limonene synthases of cannabis (Günnewich et al., 2007; Booth et al., 2017), which belong to the TPS-b clade of terpene synthases (Fig. 6; Supplemental Table S4), were expressed at high levels across most strains investigated in this study (Table 2). Cloning was successful for the corresponding cDNAs from the Canna Tsu strain (CsTPS14CT and CsTPS15CT), and a functional evaluation confirmed the annotation [(−)-limonene synthase and β-myrcene, respectively; Fig. 7, A and B]. The translated peptide sequences of β-myrcene synthases (CsTPS3FN and CsTPS15CT; excluding plastidial targeting sequence) had 13 mismatches (Supplemental Fig. S3) but identical specificity (100% β-myrcene as product with GPP as substrate). The sequence of the (−)-limonene synthase characterized as part of this study (CsTPS14CT; excluding plastidial targeting sequence) had two mismatches when compared with CsTPS1SK and nine mismatches when compared with CsTPS1FN (Supplemental Fig. S3). As described for CsTPS1SK, CsTPS14CT generated several other products, and we report the stereochemistry of those (Fig. 7A).
Figure 6.
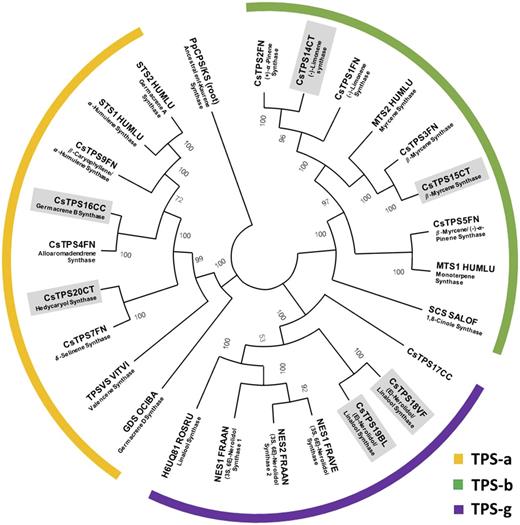
Maximum likelihood phylogenetic tree of selected, functionally characterized terpene synthases. The tree is rooted with the ancestral ent-kaurene synthase of Physcomitrella patens (PpCPS/KS). A color code is used to indicate different clades (yellow, TPS-a; green, TPS-b; and purple, TPS-g). Abbreviations are as follows: BL, Black Lime; CC, Cherry Chem; Cs, Cannabis sativa; CT, Canna Tsu; FN, Finola; FRAAN, Fragaria × ananassa; FRAVE, Fragaria vesca; HUMLU, Humulus lupulus; OCIBA, Ocimum basilicum; ROSRU, Rosa rugosa; SALOF, Salvia officinalis; VF, Valley Fire; VITVI, Vitis vinifera. The accession numbers and sequences of the terpene synthases are provided in Supplemental Table S4.
Figure 7.
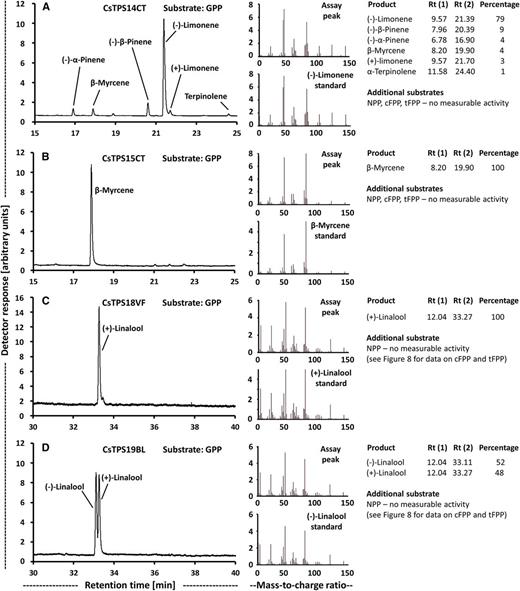
Functional characterization of cannabis terpene synthases that act on GPP as substrate. Left, Chiral gas chromatography (GC) scans; center, mass spectra of primary products; right, product distribution. A, (−)-Limonene synthase (CsTPS14CT). B, β-Myrcene synthase (CsTPS15CT). C, (E)-Nerolidol/(+)-linalool synthase (CsTPS18VF). D, (E)-Nerolidol/(+)-linalool synthase (CsTPS19BL).
The monoterpene linalool was accumulated to fairly high amounts in the Valley Fire and White Cookies strains, whereas the sesquiterpene nerolidol was quantifiable only in the Black Lime strain (Table 1). Contigs with moderate sequence identity (slightly above 50%) to bifunctional nerolidol/linalool synthases (strawberry [Fragaria spp.; Aharoni et al., 2004] and snapdragon [Antirrhinum majus; Nagegowda et al., 2008]) and considerable expression in glandular trichomes were identified in our transcriptome data sets (Table 3), and corresponding cDNAs were cloned from the Valley Fire (CsTPS18VF) and Black Lime (CsTPS19BL) strains. These sequences belong to the TPS-g clade of terpene synthases (Fig. 6; Supplemental Table S4). Heterologous expression and functional characterization confirmed that the corresponding recombinant proteins were able to catalyze the formation of (E)-nerolidol from tFPP and linalool from GPP, but no activity was detected with NPP or cFPP (Fig. 8). Interestingly, follow-up chiral separation of products from assays performed with GPP as substrate indicated that CsTPS18VF generated almost exclusively (+)-linalool, whereas CsTPS19BL produced a mixture of (−)-linalool and (+)-linalool (Fig. 7, C and D). Sequence differences across sesquiterpene synthases with different product profiles included residues with potential roles in catalysis (Fig. 9), and the implications are evaluated in "Discussion."
Figure 8.
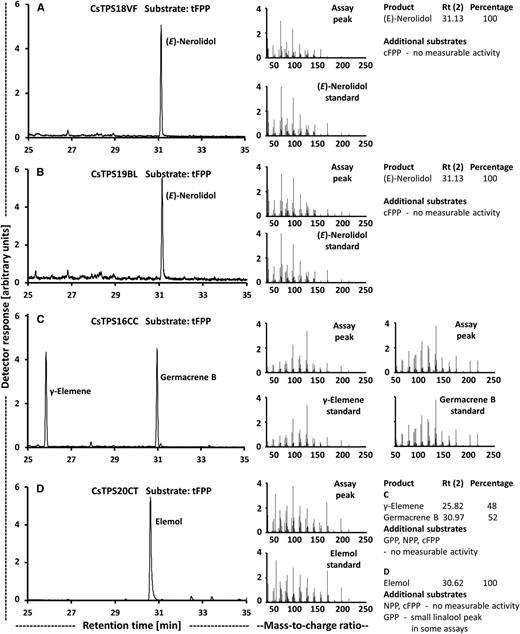
Functional characterization of cannabis terpene synthases that act on tFPP as substrate. Left, GC-mass spectrometry scans; center, mass spectra of primary products; right, product distribution. A, (E)-Nerolidol/(+)-linalool synthase (CsTPS18VF). B, (E)-Nerolidol/(+)-linalool synthase (CsTPS19BL). C, Germacrene B synthase (CsTPS16CC). D, Hedycaryol synthase (CsTPS20CT).
Figure 9.
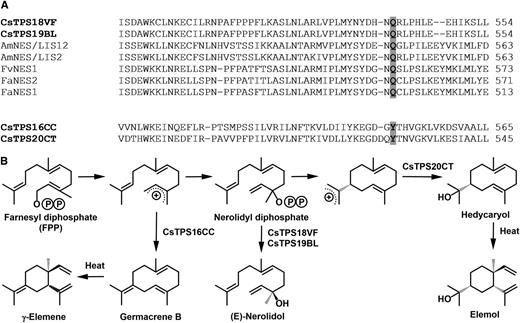
Variation of the residue putatively stabilizing carbocation intermediates correlates with outcome of catalysis in cannabis sesquiterpene synthases. A, Sequence alignment of sesquiterpene synthases (with carbocation-stabilizing residues highlighted). B, Proposed cyclization reactions catalyzed by sesquiterpene synthases. Identifiers for sequences from the literature (Aharoni et al., 2004; Nagegowda et al., 2008) are as follows: AmNES/LIS1, EF433761; AmNES/LIS2, EF433762; FvNES1, AX529002; FaNES2, AX529067; FaNES1, KX450224, with species abbreviations as follows: Am, Antirrhinum majus; Fa, Fragaria × ananassa; Fv, Fragaria vesca).
To further investigate the genetic potential for generating terpenoid chemical diversity, two representatives of the TPS-b clade of terpene synthases (CsTPS16CC and CsTPS20CT) were selected for functional characterization. CsTPS16CC had very high expression levels in the 'Cherry Chem' strain (Table 3). The sequence was most similar to that of the previously characterized alloaromadendrene synthase (Booth et al., 2017; Fig. 6; Supplemental Table S4). In our assays, the recombinant protein generated germacrene B from tFPP (Fig. 8C), with γ-elemene being detected as a thermal breakdown product (de Kraker et al., 1998). Other prenyl diphosphate substrates were not accepted as substrates with appreciable conversion rates (Fig. 8). The 'Canna Tsu' strain had a particularly high expression level of CsTPS20CT (Table 3). Its closest neighbor in the sequence relatedness tree was a putative δ-selinene synthase from cannabis (Booth et al., 2017; Fig. 6; Supplemental Table S4). Functional assays with the purified, recombinant protein indicated a conversion of tFPP to elemol, a thermal breakdown product of the sesquiterpene hedycaryol (Koo and Gang, 2012; Hattan et al., 2016), but there was little or no activity with other prenyl diphosphate substrates (Fig. 8D). In summary, we demonstrate that the resources and approaches described here can be employed to identify candidates and subsequently characterize functions of terpene synthase genes that belong to three different clades, thereby contributing to a better understanding of the genetic determinants of terpenoid chemical diversity in cannabis.
DISCUSSION
Utility of Transcript Profiling for Strain Differentiation
Competition in decriminalized retail markets for cannabis has put pressure on breeders to differentiate their product from that of their competitors. This has led to branding with a plethora of distinct and memorable names, which has caused both confusion and controversy (Small, 2015). Chemical profiling can be employed as a powerful tool in strain differentiation, but adding genotyping information further increases the resolution of the analysis. The differentiation of drug-type and fiber-type cannabis strains can be achieved with standard genotyping analyses (Piluzza et al., 2013). However, a differentiation of genetically related strains has been much more challenging (Sawler et al., 2015; Punja et al., 2017). Traditional genotyping approaches benefit significantly from high-quality reference genome sequences (Scheben et al., 2017), but, unfortunately, only fairly low-quality genome sequences have been published for two cannabis strains (van Bakel et al., 2011). We employed RNA-seq as an alternative approach for genotyping (Haseneyer et al., 2011), which does not depend on prior sequence data (Wang et al., 2009). We used RNA-seq to obtain the transcriptome of glandular trichome cells of nine selected cannabis strains (with three biological replicates each). Importantly, statistical analyses of these data sets allowed the differentiation of strains into broader clades (descendants of landraces of C. sativa or C. indica) but also resulted in the full separation of all individual strains (with biological replicates clustering closely together; Fig. 3). We fully recognize that RNA-seq is not a viable option for routine genotyping, but it can be used to develop single-nucleotide polymorphism-based genotyping platforms. This approach has been employed successfully for a number of crops, including alfalfa (Medicago sativa; Yang et al., 2011), maize (Zea mays; Hansey et al., 2012), and wheat (Triticum aestivum; Ramirez-Gonzalez et al., 2015). Our data sets are therefore highly valuable for building resources for follow-up research with cannabis. As an added benefit, RNA-seq data can be used for gene expression analysis, thereby providing a functional context, which is discussed in more detail below.
Utility of Metabolite Profiling for Strain Differentiation
We assessed the utility of cannabinoid and terpenoid profiling, in addition to strain differentiation by genotyping as discussed above, to demarcate nine commercial cannabis strains. Two independent statistical approaches, PCA and OPLS-DA, grouped biological replicates closely together while still separating individual strains and classes of strains (those of C. sativa or C. indica heritage; Fig. 4). Several authors have advocated the profiling of both cannabinoids and terpenoids in recent publications (Fischedick et al., 2010; Elzinga et al., 2015; Aizpurua-Olaizola et al., 2016; Hazekamp et al., 2016; Fischedick, 2017; Lewis et al., 2018; Orser et al., 2018; Richins et al., 2018; Sexton et al., 2018). The key advantage of this approach over merely profiling cannabinoids lies in the enormous diversity of terpenoids accumulated in cannabis (and in other plants as well), which significantly increases the power of statistical analyses. It also reflects the fact that many users select cannabis strains based on both the reported THC content and aroma (which is largely imparted by terpenoids; Gilbert and DiVerdi, 2018). A comprehensive analysis of cannabis strains recently indicated the presence of close to 200 detectable volatiles, which were tentatively identified based on searches against various spectral databases (Rice and Koziel, 2015). A notable challenge with terpenoid profiling pertains to the limitation that authentic standards are often very costly or unavailable from commercial sources, which is particularly true for sesquiterpenes (dozens detected by Rice and Koziel [2015]). Commercial cannabis testing laboratories therefore rarely offer services that comprise more than 20 terpenoids. While such analyses may detect the most abundant terpenoids for popular strains, it is not unlikely that important aroma volatiles with a low odor detection threshold could be missed (Chin and Marriott, 2015). Another reason why a comprehensive profiling of terpenoids would be desirable relates to testing the validity of the entourage effect, the proposed synergism between cannabinoids and other constituents (in particular terpenoids) that might affect the experience of the user (Gertsch et al., 2008; Russo, 2011). Should such effects be substantiated by empirical evidence, it would be advisable to reconsider the current laws and rules for formulations containing cannabis extracts, which are based solely on THC. An improved understanding of terpenoid phytochemistry in cannabis would be an important first step in this direction (Booth and Bohlmann, 2019).
Coregulation of Metabolic Pathways in Cannabis Is Consistent with Gene Expression Patterns Commonly Observed in Glandular Trichomes
Our statistical analyses using the WGCNA package indicated a tight correlation of biosynthetic genes with cannabinoid and terpenoid end products (Fig. 5). We recently performed a meta-analysis of gene expression patterns in glandular trichomes across various species (Zager and Lange, 2018). One of the conclusions, consistent with the data presented here, was that gene expression patterns correlate well with the metabolic specialization in these anatomical structures. Coregulation has been observed for genes across multiple pathways of specialized metabolism, such as cannabinoids and terpenoids (this study), monoterpenes and diterpenes (Salvia pomifera; Trikka et al., 2015), flavonoids and acyl sugars (Salpiglossis sinuata and Solanum quitoense; Moghe et al., 2017), and bitter acids and prenylflavonoids (Humulus lupulus; Kavalier et al., 2011; Clark et al., 2013). These tight gene-to-metabolite correlations were also reflective of predicted fluxes through the relevant pathways (Zager and Lange, 2018). In contrast, gene expression patterns appear to be less predictive of fluxes through central carbon metabolism, where regulation at the protein level plays a more significant role (Paul and Pellny, 2003; Koch, 2004; Gibon et al., 2006; Schwender et al., 2014; Rocca et al., 2015). This does not mean that feedback regulation of specialized metabolism is negligible in glandular trichomes; there is just a particularly strong overall gene-to-metabolite correlation, and unraveling the details will be an exciting topic for future research.
Functional Characterization of Terpene Synthases Contributes to an Improved Understanding of the Genetic Determinants of Terpenoid Diversity
The observed gene-to-metabolite correlations in cannabis glandular trichomes provided opportunities for gene discovery efforts. Booth et al. (2017) analyzed transcriptome data sets obtained with the Finola and Purple Kush strains to obtain candidate genes for terpene synthases that were subsequently characterized to encode enzymes for the production of 14 monoterpenes and sesquiterpenes. Those that contribute to the formation of some of the common monoterpenes and sesquiterpenes [e.g. β-myrcene, (−)-limonene, α-pinene, β-caryophyllene, and α-humulene] were found to be expressed at fairly high levels across the strains included in this analysis, whereas those that generate less common products [e.g. (Z)-β-ocimene, γ-eudesmol, alloaromadendrene, δ-selinene, and valencene] were found to be expressed only in a limited number of strains or not at all (Table 3). To assess sequence variation among these genes, we cloned genes with high sequence identity to the previously characterized β-myrcene and (−)-limonene synthases.
Prior to this study, a notable gap existed with regard to the terpene synthases underlying the formation of the monoterpene linalool and the sesquiterpene nerolidol, which are both common constituents in cannabis resin. We now identified a gene coding for an enzyme (CsTPS19BL) that generates a mixture of (+)-linalool and (−)-linalool from GPP and (E)-nerolidol from tFPP in the Black Lime strain. We also cloned a putative ortholog from the Valley Fire strain to evaluate the effects of sequence variation. Interestingly, the encoded enzyme (CsTPS18VF) had the same specificity as CsTPS19BL with regard to the tFPP substrate [(E)-nerolidol as product]; however, with GPP as substrate, (+)-linalool was detected as the essentially exclusive product. This difference in specificity is surprising given that the peptide sequences have only three mismatches (Supplemental Fig. S3).
Finally, we cloned genes that, based on sequence relatedness, were expected to code for enzymes that generate sesquiterpene products not previously detected in assays with cannabis terpene synthases. Indeed, CsTPS16CC was demonstrated to produce germacrene B and CsTPS20CT formed hedycaryol as primary product. In assays with CsTPS16CC, γ-elemene was also detected, but this is a well-known product of thermal degradation in the GC inlet (de Kraker et al., 1998). Elemol was the sole product of assays with CsTPS20CT, which is also a thermal degradation product, in this case of hedycaryol (Koo and Gang, 2012; Hattan et al., 2016). Consequently, the enzyme activities are referred to as germacrene B synthase and hedycaryol synthase, respectively. To the best of our knowledge, the sesquiterpenes generated by these terpene synthases (germacrene B and hedycaryol) have not been identified in cannabis samples yet, indicating the need for a more comprehensive coverage of terpenoids to better understand strain-specific aroma profiles. It should also be noted that several recent studies reporting on comprehensive chemical and sensory analyses of volatiles emitted from cannabis found that nonterpenoid alcohols and aldehydes have potent odor impacts (Rice and Koziel, 2015; Wiebelhaus et al., 2016; Calvi et al., 2018). These considerations indicate that more emphasis needs to be placed on comprehensive metabolite profiling, including cannabinoids and terpenoids but also extending to other volatiles, for future efforts focused on strain characterization.
With a larger number of functionally characterized genes in cannabis, sequence comparisons are now allowing us to ask questions about some of the determinants of specificity. The overall sequence identity of the sesquiterpene synthases characterized here is fairly low (less than 70% at the amino acid level), but there are striking differences in the nature of a conserved aromatic residue (Tyr-527) that had previously been hypothesized to stabilize the positive charge of the carbocation occurring during the formation of a germacrene intermediate in the epi-aristolochene synthase catalytic sequence (Starks et al., 1997). The equivalent residues in sesquiterpene synthases that catalyze the formation of cyclic products (CsTPS16CC and CsTPS20CT) are also Tyr residues (Fig. 9). In contrast, Gln residues occupy this position in CsTPS18VF, CsTPS19BL, and other characterized enzymes of the TPS-g clade (Fig. 9A; Aharoni et al., 2004; Nagegowda et al., 2008), which, possibly because of insufficient carbocation stabilization, generate (E)-nerolidol as a noncyclic product (Fig. 9). Testing this hypothesis will be an important future goal for follow-up research.
MATERIALS AND METHODS
Plant Materials and Chemicals
Clonal plant cuttings of nine Cannabis sativa (cannabis) strains (Sour Diesel, Canna Tsu, Black Lime, Valley Fire, White Cookies, Mama Thai, Terple, Cherry Chem, and Blackberry Kush) were placed in 250-L pots and grown in hoop-style, light-deprivation greenhouses at Shadowbox Farms in Williams, Oregon, under a 18-h-light/6-h-dark regime (natural light) to stimulate vegetative growth, before shifting to a 12-h-light/12-h-dark cycle to induce flowering. The length of these time periods varied from strain to strain and was adjusted based on phenotypic evaluations. All aspects of plant growth, harvest, and transport were performed in accordance with the laws and rules under Chapter 475B, as released by the Oregon Liquor Control Commission. Plant harvest was performed when the consistency of glandular trichome content had changed from a turbid white to clear and before another change to an amber-like color occurred. For most strains, the pistils had changed color from white to yellow or orange. Buds were harvested, parts with low glandular trichome content were removed using scissors, and the remainder were placed on ice until further processing (always within 3 h). Monoterpene and sesquiterpene reference standards were purchased from Restek. Cannabinoid reference standards were obtained from Sigma-Aldrich. Solvents for extraction were procured from Sigma-Aldrich Solvents and chemicals for chromatography were sourced from Burdick & Jackson. Substrates for enzyme assays (GPP, NPP, and E,E-FPP) were prepared synthetically (Davisson et al., 1986) or obtained from a commercial source (Z,Z-FPP; Echelon Biosciences). The sources of standards for enzyme assays were as follows: germacrene B, isolated as a side product from assays with germacrene C synthase (Colby et al., 1998); γ-elemene, obtained by heating germacrene B under argon (de Kraker et al., 1998); elemol, institutional chemical repository (originally purchased from Parchem); hedycaryol, institutional chemical repository (source unknown); (S)-(+)-linalool, isolated from coriander (Coriandrum sativum) oil; (−)-limonene, (+)-limonene, (R)-(−)-linalool, β-myrcene, (E)-nerolidol, (−)-α-pinene, (−)-β-pinene, and α-terpinolene, all purchased from Sigma-Aldrich.
Metabolite Extraction and Analysis
Cannabinoids and terpenoids were extracted and quantified according to Fischedick et al. (2010), with modifications, at a testing facility with accreditation by ISO/IEC 17025 and licensed through the National Environmental Laboratory Accreditation Program (Evio Labs). Briefly, roughly 2 g of fresh bud tissue was crushed in a Falcon tube, suspended in 10 mL of methyl tert-butyl ether (containing 1-octanol as internal standard) with gentle shaking for 15 min, followed by centrifugation at 2,000g for 5 min. The supernatant was transferred to a new vial, and the plant material was extracted two more times as above (no addition of internal standard to solvent). The combined supernatants were filtered through a polytetrafluoroethylene syringe filter (0.45 μm pore size, 25 mm diameter), and an aliquot was transferred to a screw-cap glass vial, which was stored at −20°C until further analysis. Following extraction, the remaining plant material was dried in an oven (50°C) and weighed to determine dry weights for each sample.
Cannabinoids were separated via HPLC (model LC-2030C; Shimadzu) using a Kinetex C18 reverse-phase column (50 × 4.6 mm, 2.6 µm particle size; Phenomenex) and a binary gradient of solvent A (water containing 0.1% [v/v] formic acid and 10 mM ammonium formate) and solvent B (methanol containing 0.05% [v/v] formic acid) with the following settings: 0 to 9 min, 68% to 78% B; 9 to 11.9 min, 78% to 100% B; 11.9 to 13.5 min, hold at 100% B. Analytes were monitored at 228 nm in a diode array detector. Peak identification was achieved based on comparisons of retention times and spectral characteristics with those of authentic cannabinoid reference standards. Analytes were quantified based on calibration curves acquired with authentic standards. The validation of the analytical method was performed according to Fischedick et al. (2010).
Terpenoids were separated via GC (model 6890; Agilent Technologies) using a DB5 column (30 m × 25 mm, 25 μm film thickness; Agilent Technologies) and detected with a flame ionization detector. The conditions for separation were as follows: injector at 250°C, 20:1 split injection mode (1 μL injected); detector at 250°C (H2 flow at 30 mL min−1, airflow at 400 mL min−1, makeup flow [He] at 25 mL min−1); oven heating from 40°C to 120°C at 2°C min−1, then ramped to 200°C at 50°C min−1, with a final hold at 200°C for 2 min. GC peaks were identified based on comparisons of retention times of authentic standards (purchased from Sigma-Aldrich). Analytes were quantified based on calibration curves acquired with authentic standards. The validation of the analytical method was performed according to Fischedick et al. (2010).
RNA Isolation from Glandular Trichomes and cDNA Library Preparation
Secretory cells of glandular trichomes were removed from 10 to 15 g of bud tissue by surface abrasion and then collected by filtering through a series of nylon meshes (Lange et al., 2000). Total RNA was isolated from secretory cells using the RNeasy Plant kit (Qiagen) according to the manufacturer’s instructions. RNA integrity was determined using a BioAnalyzer 2100 (Agilent Technologies). cDNA libraries from 1 to 2 μg of total RNA were generated using the SuperScript III Reverse Transcriptase kit (Invitrogen) according to the manufacturer’s instructions.
RNA-Seq and Transcriptome Assembly
RNA-seq libraries were prepared from 250 ng of total glandular trichome RNA with the Stranded mRNA-Seq Poly(A) Selection kit (KAPA Biosystems). The quality and quantity of the sequencing library were assessed using a Bioanalyzer 2100 and a Qubit 3.0 Fluorometer (Agilent Technologies and Life Technologies). Sequencing of 150-bp paired-end reads was performed on a HiSeq 4000 instrument (Illumina). Sequenced reads were trimmed of adapter sequences with Trimmomatic (Bolger et al., 2014), and sequence quality was checked with FastQC (Andrews, 2010). Trimmed sequences were merged and assembled using the Trinity de novo assembler, and downstream functional annotation of the assembly was performed with Trinotate (Haas et al., 2013). The resulting transcriptome assembly contained 514,208 contigs, with a mean contig length of 875 bp and an N50 value of 1,529 bp. Transcript abundance in each RNA-seq data set (three biological replicates per strain) was determined with RSEM (Li and Dewey, 2011).
Analysis of Global Gene Expression Patterns and GO Enrichment
Testing for differential gene expression across strains was performed using the Bioconductor package DESeq2 (version 1.18.1; Love et al., 2014). P values were adjusted using the Benjamini-Hochberg procedure (Benjamini and Hochberg, 1995). An adjusted P value (false discovery rate) ≤ 1e-10 and log2 ratio ≥ 3 were set as thresholds. A cluster analysis of gene expression patterns between strains was performed within the Trinity suite (Haas et al., 2013) by partitioning genes into clusters by cutting the hierarchically clustered gene tree at 60% height of the tree. A GO enrichment analysis of differentially expressed genes was performed using the GOseq package in R (Young et al., 2010). GO terms with an adjusted P < 0.01 were considered significantly enriched.
Gene Coexpression Network Analysis
A gene coexpression network was built using the WGCNA package in R (Langfelder and Horvath, 2008). Transcriptome data sets were filtered to remove genes with an average expression value of 50 TPM or smaller. Coexpression modules were identified using the function blockwiseModules with the following settings: power at 7, mergeCutHeight at 0.55, and minModuleSize at 30. Eigengene values were determined for each coexpression module to test for association significance. Modules with similar eigengene values were merged to obtain the final coexpression modules.
Phylogenetic Analysis of TPS Candidates
The identification of TPS candidate genes was accomplished by searching the translated transcriptome consensus assembly against a manually curated protein database specific to characterized plant TPSs using the BLASTx algorithm. A reciprocal search (tBLASTn) was performed with sequences of 114 characterized angiosperm TPSs against the assembly for each individual strain. Predicted TPS sequences were then analyzed for gene expression values across strains. Translated amino acid sequences of these and reference TPSs (from C. sativa and Humulus lupulus) were aligned using the MUSCLE algorithm. Alignments were analyzed with maximum likelihood analysis using a Jones-Taylor-Thornton model with gamma distribution for rates among amino acid sites. One thousand bootstrap replicates were then used to construct a phylogeny using MEGA7 (Jones et al., 1992; Kumar et al., 2016).
Cloning of TPS cDNAs
First-strand cDNA was prepared from RNA with the SuperScript III First Strand Synthesis kit (Invitrogen) with random hexamer oligonucleotides. Open reading frames for TPSs were amplified using gene-specific primers (Supplemental Table S5; amplicons for full-length cDNAs were generated for putative sesquiterpene synthases, whereas cDNAs devoid of the plastidial targeting sequence were amplified for putative monoterpene synthases). Amplicons were ligated into the pGEM-T Easy vector (Promega) and sequence verified. For expression in Escherichia coli, full-length or truncated genes were subcloned into the pSBET expression vector (predigested with NdeI and BamHI). Several terpene synthase cDNAs (CsTPS18VF, CsTPS19BL, and CsTPS20CT) were purchased as synthetic products (in the pET28B expression vector) from GenScript.
In Vitro Functional Assays for Recombinant TPSs
Plasmids were transformed into chemically competent cells of several E. coli strains [BL21 (DE3), C41 (DE3), C43 (DE3), C43 (DE3) pLysS, and ArcticExpress (DE3)], which were then grown in 25 mL of liquid Luria-Bertani medium at 37°C with shaking to an OD600 of 0.8. Expression of TPS genes was induced with 0.1 or 0.5 mM isopropyl β-D-1-thiogalactopyranoside (Goldbio), and cells were grown for another 24 h at three different temperatures (16°C, 10°C, and 4°C). Bacterial cells were harvested by centrifugation at 5,000g and resuspended in 300 μL of MOPSO buffer, pH 7, supplemented with 1 mM DTT (Goldbio). Cells were lysed using a model 475 sonicator (VirTis), with three 15-s bursts and cooling on ice between bursts. The resulting homogenate was centrifuged at 15,000g for 30 min at 4°C, and the clear supernatant was mixed with ceramic hydroxyapatite (Bio-Rad). The purification of recombinant protein was performed as described by Srividya et al. (2016) for constructs in the pSBET expression vector, whereas those in the pET28B expression vector were purified over Ni2+ affinity columns according to the manufacturer’s instructions (Novagen-EMD Millipore). In vitro assays were performed in 2-mL glass vials containing 200 µg of purified enzyme in MOPSO buffer containing DTT and MgCl2 (total volume of 100 µL). A prenyl diphosphate substrate (GPP, NPP, tFPP, or cFPP) was added to a final concentration of 0.5 mM. The assay mixtures were overlaid with 100 µL of n-hexane (Avantor) and incubated at 30°C for 16 h on a multitube rotator (Labquake; Barnstead Thermolyne). The enzymatic reaction was stopped by vigorous mixing of the contents of the tubes, followed by 30 min at −80°C for phase separation. The organic phase was removed and transferred to glass vial inserts and stored in GC vials at −20°C until further analysis.
Enzymatically formed products were analyzed on a 6890N gas chromatograph coupled to a 5973 mass selective detector (Agilent). Analyte separation was achieved under the conditions developed by Adams (2007), which includes a comprehensive resource for spectral comparisons of volatiles. The chiral separation of monoterpenes was achieved as described by Turner et al. (2019). Enzymatically generated products were identified based on retention times and mass spectral properties when compared with those of authentic standards.
Statistical Analyses
For metabolite analyses, statistical analyses were performed in R using the MetaboAnalystR package (Chong and Xia, 2018). Quantitative terpenoid and cannabinoid data were scaled by dividing mean centered values by the SD of each variable to generate principal component loadings. Principal components were then plotted in three dimensions within the R environment. OPLS-DA analysis was also performed in the same way using the MetaboAnalystR package. Differential gene expression patterns were assessed using the Bioconductor package DESeq2 (version 1.18.1; Love et al., 2014), with the P value for the Benjamini-Hochberg false discovery threshold being adjusted to 1e-10 or less and the log2 fold-change ratio to 3 or greater. Cluster analysis of differential gene expression was performed within the Trinity suite (Haas et al., 2013) by cutting the clustered gene tree at 60% tree height, and differentially expressed genes were subjected to further analysis within GOseq as described above (Young et al., 2010). TPS candidates were identified based on sequence identity with functionally characterized TPSs in tBLASTn searches. Candidates with e-values > 0.001 and bitscores < 250 were removed from further consideration.
Accession Numbers
The raw transcriptome sequence data for cannabis strains are available at the National Center for Biotechnology Information Sequence Read Archive, project number PRJNA498707. Nucleotide sequences for genes characterized as part of this study were deposited in GenBank and received the accession numbers MK131289 (CsTPS16CC), MK801762 (CsTPS20CT), MK801763 (CsTPS19BL), MK801764 (CsTPS18VF), MK801765 (CsTPS15CT), and MK801766 (CsTPS14CT).
Supplemental Data
The following supplemental materials are available.
- Supplemental Figure S1. Alignment of translated peptide sequences, based on RNA-seq data, of THCA synthase across cannabis strains.
- Supplemental Figure S2. Nucleotide and translated peptide sequence, based on RNA-seq data, of CBDA synthase from the cannabis strain Canna Tsu.
- Supplemental Figure S3. Alignment of terpene synthase sequences.
- Supplemental Table S1. Statistics of de novo assemblies performed based on cannabis glandular trichome-specific RNA-seq data sets.
- Supplemental Table S2. Annotation of transcripts represented in cannabis glandular trichome-specific RNA-seq data sets.
- Supplemental Table S3. Clustering of genes into coexpression modules obtained by WGCNA of cannabis glandular trichome-specific RNA-seq data sets.
- Supplemental Table S4. Accession numbers and sequences of terpene synthases considered for phylogenetic analysis.
- Supplemental Table S5. Primers used to clone cannabis cDNAs for functional characterization.
ACKNOWLEDGMENTS
This study was supported by gifts from private individuals, and we are grateful for their generosity. We also thank Shadowbox Farms for allowing A.S. to harvest plant materials.
Author notes
1. This work was supported by gifts from private individuals, with no association with the cannabis industry. All work with raw materials was conducted by A.S. at a facility accredited to National Environmental Laboratory Accreditation Program standards and licensed by the Oregon Liquor Control Commission. Work of employees of Washington State University (J.J.Z., I.L., and B.M.L.) was performed in accordance with the OR/ORSO Guideline of July 2017.
2. Author for contact: lange-m@wsu.edu.
3. Senior author.
The author responsible for distribution of materials integral to the findings presented in this article in accordance with the policy described in the Instructions for Authors (www.plantphysiol.org) is: B. Markus Lange (lange-m@wsu.edu).
J.J.Z., A.S., and B.M.L. designed the experiments; A.S. harvested and extracted plant materials; A.S. performed metabolite analyses; J.J.Z., I.L. and N.S. cloned terpene synthase genes and performed functional assays; J.J.Z., A.S., and B.M.L. analyzed the data; J.J.Z. and B.M.L. wrote the article, with input from all authors.
[OPEN]
Articles can be viewed without a subscription.
www.plantphysiol.org/cgi/doi/10.1104/pp.18.01506
© 2019 American Society of Plant Biologists. All Rights Reserved.
© The Author(s) 2019. Published by Oxford University Press on behalf of American Society of Plant Biologists. This is an Open Access article distributed under the terms of the Creative Commons Attribution License (https://creativecommons.org/licenses/by/4.0/), which permits unrestricted reuse, distribution, and reproduction in any medium, provided the original work is properly cited.
© 2019 American Society of Plant Biologists. All Rights Reserved.
See original article at: https://academic.oup.com/plphys/article/180/4/1877/6117720